


 Financials
Condensed Interim Financial Statements For The Six Months Ended 30 June 2025
Financials Archive![]() Note: Files are in Adobe (PDF) format.
Note: Files are in Adobe (PDF) format.
Please download the free Adobe Acrobat Reader to view these documents.
CONSOLIDATED STATEMENT OF COMPREHENSIVE INCOME
CONDENSED INTERIM BALANCE SHEETS
Review of Performance
Review of Statement of Comprehensive Income
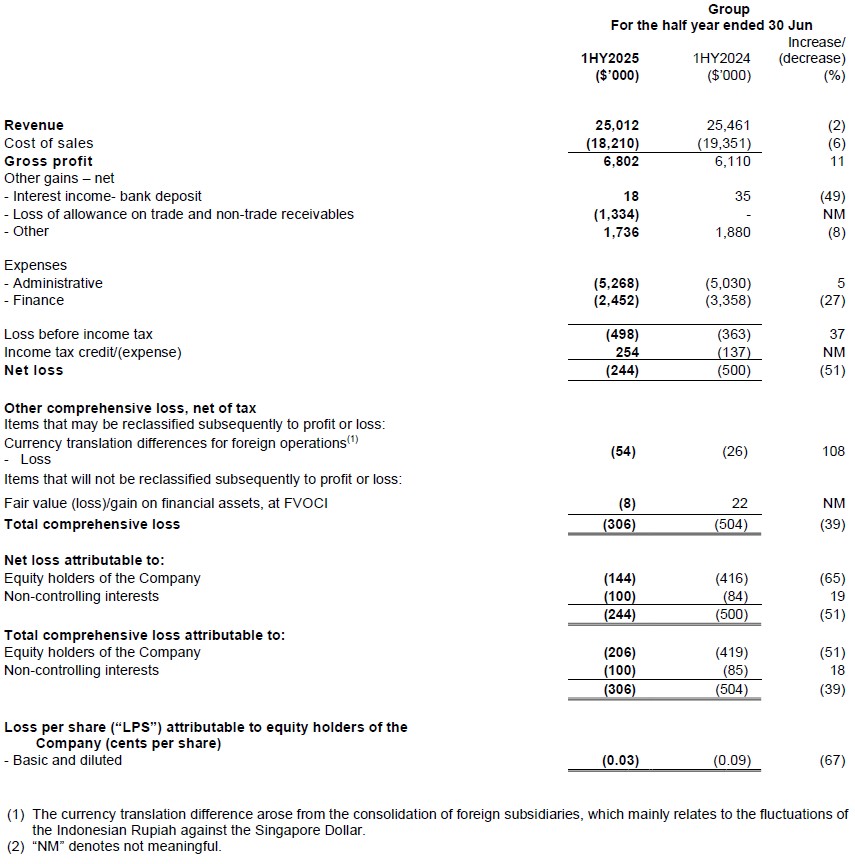
Revenue
Revenue for 1HY2025 declined by 2%, or $0.45 million, from $25.46 million in 1HY2024 to $25.01 million in 1HY2025. The decrease was mainly due to lower contributions from the Offshore & Engineering and Energy services segments, partially offset by an increase in the Marine segment:
- Offshore & Engineering segment ("O&E") - decreased by $1.16 million; and
- Energy services segment - decreased by $0.83 million;
- Marine segment - increased by $1.54 million.
Offshore & Engineering segment
Revenue from the O&E segment represented 6% of total revenue for 1HY2025 (1HY2024: 10%).
Revenue from the O&E segment was $1.34 million in 1HY2025, down from $2.50 million in 1HY2024. This represents a decrease of $1.16 million, or 46%, compared to 1HY2024. The decline was mainly due to the absence of charter income from two dredger vessels during 1HY2025.
Marine segment
Revenue from the Marine segment represented 53% of total revenue in 1HY2025 (1HY2024: 46%).
The Marine segment generated revenue of $13.34 million in 1HY2025, up from $11.81 million in 1HY2024. The increase was mainly due to the following:
- Higher deliveries of new-build propellers, which increased by $2.38 million, from $5.80 million in 1HY2024 to $8.18 million in 1HY2025;
Partially offset by
-
lower revenue from the segment's maintenance, repair, and overhaul (MRO) services, which decreased from $3.21 million in 1HY2024 to $2.66 million in 1HY2025.
Within the segment's MRO services:- Revenue from the propulsion system MRO services decreased by $0.76 million from $4.45 million in 1HY2024.
- Revenue from shipyard activities remained relatively stable, at $1.48 million in 1HY2025 compared to $1.56 million in 1HY2024.
Energy Services segment
Revenue from the Energy Services segment represents 41% of total revenue for 1HY2025 (1HY2024: 44%).
The revenue declined to $10.33 million, from $11.16 million in 1HY2024, a decrease of $0.83 million or 7%, mainly due to:
- a fast-track trading contract of $4.46 million recognised in 1HY2024, as compared to only $0.50 million in 1HY2025;
- Revenue from toxic waste collection remains comparable for both reporting periods, 1HY2025 and 1HY2024, at approximately $6.33 million.
Offset with
- Higher revenue from the conversion of waste to by-products for sale, which increased by $3.15 million from $0.36 million during 1HY2024 to $3.50 million in 1HY2025.
Cost of sales, gross profit ("GP") and gross profit margin
Despite the relatively flat revenue for both periods, 1HY2025 and 1HY2024, as explained above, the Group's cost of sales (COGS) decreased by 6%, from $19.35 million in 1HY2024 to $18.21 million in 1HY2025. The decrease in cost of sales is in line with the costs associated with a fast-track oil trading contract with a particular customer from the Energy Services segment. As a result, gross profit improved from $6.11 million to $6.80 million, an increase of $0.69 million or 11%.
Consequently, the Group's gross profit margin (GP%) also rose from 24% in 1HY2024 to 27% in 1HY2025.
The following factors contributed to the increase in gross profit:
Energy Services segment: Gross profit increased by $1.71 million, from $0.87 million in 1HY2024 to $2.58 million in 1HY2025. This increase was in line with:
- the higher revenue contribution from by-product sales; and
- lower volume of transactions in 1HY2025 from a fast-track oil trading contract, which contributed to a single-digit GP%.
Marine segment: The Marine segment recorded a slight decline in gross profit of $0.27 million, from $5.25 million in 1HY2024 to $4.98 million in 1HY2025. As a result, the gross profit margin fell from 44% to 37%. The reduction in this segment's GP margin was mainly due to lower revenue from the propulsion system MRO services.
Offshore & Engineering segment: The increase in the gross loss of the O&E segment was mainly due to the lower revenue in 1HY2025, as explained above. Despite the absence of charter income, the Group continued to incur depreciation and upkeep costs for the two dredger vessels. In addition, certain relocation and handling expenses were incurred during the period, further contributing to the segment's gross loss.
Administrative expenses
Administrative expenses for 1HY2025 amounted to $5.27 million, remaining broadly in line with the $5.03 million recorded in 1HY2024. The slight increase was attributed to a higher headcount in the Marine segment, supporting the ongoing transformation of the propulsion business.
Finance expenses
Finance expenses for 1HY2025 amounted to $2.45 million, a 27% decrease, or approximately $0.91 million, from $3.36 million in 1HY2024. This reduction was mainly attributable to the gradual decrease in borrowings through monthly principal repayments, coupled with lower effective interest rates on bank borrowings.
Share of loss of associated companies
The Group and the Company's share of losses in its associated company have already exceeded its interest as of FY2023, hence the Group and the Company have not recognised further losses in 1HY2025.
Net loss
Despite the improved gross margin and reduced financing costs on bank borrowings, bottom-line performance remained weak due to lower other income recognised during 1HY2025, slightly higher operating expenses and a $1.33 million loss allowance on trade and non-trade receivables.
Review of Balance Sheet
Current assets
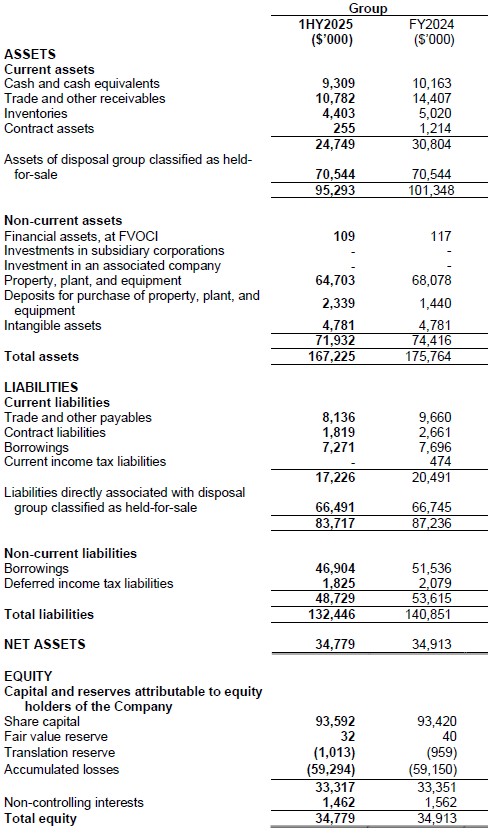
As at 30 June 2025, the Group's current assets stood at $95.29 million, representing a decrease of $6.06 million or 6% compared to $101.35 million as at FY2024. This decline was mainly attributable to the following factors:
- A decrease in cash and cash equivalents of $0.85 million, as detailed in the Review of Condensed Interim Consolidated Statement of Cash Flows.
- A net decrease in trade and other receivables of $3.63 million, from $14.41 million in FY2024 to $10.78 million in 1HY2025. This was largely due to higher collection of trade receivables, and a loss allowance of $1.33 million recognised following the compulsory liquidation of a customer from the Offshore & Engineering segment.
- Inventories declined by $0.62 million, mainly due to a lower volume of secured and ongoing orders for new-build propellers in the Marine segment.
- Contract assets decreased, as certain work that was completed prior to year-end FY2024 was subsequently billed and collected in January 2025, amounting to approximately $0.78 million.
Non-current assets
As at 30 June 2025, the Group's non-current assets stood at $71.93 million, representing a 3% decrease, or $2.49 million, from $74.42 million as at 31 December 2024. The decline was mainly due to the following:
- net decrease in property, plant, and equipment (PPE) of $3.38 million. This was partially offset by an increase in deposits for the purchase of PPE, primarily related to capital investments in the Marine segment.
- A fair value loss of $8,000 on financial assets measured at fair value through other comprehensive income (FVOCI).
Current liabilities
As at 30 June 2025, the Group's current liabilities decreased by $3.52 million, or 4%, from $87.24 million at 31 December 2024 to $83.72 million. The decline was primarily due to the following factors:
- A reduction in trade and other payables of $1.53 million, mainly due to the settlement of outstanding payables and accrued expenses during 1HY2025.
- A $0.84 million decrease in contract liabilities, or 32%, from $2.66 million to $1.82 million, as revenue was recognised from previously deferred customer advances under the Marine segment.
- A net decrease in current borrowings of $0.43 million, primarily due to the full repayment of $0.56 million in unsecured borrowings that were outstanding as at FY2024.
- Current income tax liabilities reduced to nil, from $0.47 million, following tax payments made during the period and the absence of new tax provisions in 1HY2025.
- A slight reduction in liabilities directly associated with the disposal group held-for-sale by approximately $0.25 million, mainly due to leasehold rental payments and monthly repayments of borrowings tied to the disposal group.
Non-current liabilities
As at 30 June 2025, the Group's non-current liabilities decreased by $4.89 million, or 9%, from $53.62 million
at 31 December 2024 to $48.73 million. This reduction in long-term obligations reflects the Group's ongoing
efforts to deleverage its balance sheet and improve its financial position.
The decline was mainly attributed to:
- A reduction in non-current borrowings of $4.63 million, from $51.54 million to $46.91 million, due to scheduled repayments of long-term loans and lease liabilities.
- A decrease in deferred income tax liabilities of $0.25 million, from $2.08 million to $1.83 million, reflecting changes in temporary differences and tax provisions.
Review of Condensed Interim Statement of Cash Flows
The Group reported a net cash outflow of $0.86 million, ending 1HY2025 with $8.78 million in cash and cash equivalents, down from $9.49 million in 1HY2024.
In 1HY2025, the Group generated net cash from operating activities of $8.30 million as compared to $6.84 million in 1HY2024. This was due to an improvement in working capital movements arising from receivables, inventories, contract assets and non-cash adjustments, such as depreciation and allowances. The cash inflow from operations was partially offset by an income tax payment of $0.47 million. This payment relates to income tax payable recorded in FY2024 for Year of Assessment 2023, primarily attributable to taxable profits from the Marine segment.
Net cash used in investing activities was $0.85 million, compared to a net inflow of $0.52 million in 1HY2024. The decline was due to lower asset disposals and higher capital expenditures (up from $0.73 million to $1.80 million). There was no disposal of non-current assets classified as held-for-sale and or acquisition of a subsidiary in 1HY2025, unlike in 1HY2024.
Financing activities amounted to $8.31 million, slightly more than $7.82 million in 1HY2024, largely driven by repayments of bank borrowings and lease liabilities, and interest payments. The Group also reduced trade financing facilities by $0.28 million.
Commentary
Outlook
Macro conditions remain mixed and complex. Geopolitical tensions and persistent cost volatility continue
to influence customer sentiment and procurement timing across our served industries. Near-term demand
is therefore expected to be uneven across segments, with customers staying selective on project starts and
maintenance scheduling.
Offshore & Engineering (O&E). The Group has been gradually scaling down activities in this segment and is focusing on the provision of engineering, inspection, and maintenance services for offshore structures, with operations primarily based in Singapore and Batam. Activities in this segment have been streamlined to these core service areas in tandem with the scaling up of the Group's waste management business. Near-term contribution is expected to remain modest, in line with the segment's smaller scope of operations.
Marine. Deliveries of new-build propellers supported 1HY2025 performance. Looking ahead, order visibility exists but remains uneven and may fluctuate with broader market conditions. For propulsion MRO services, a weaker operating environment could prompt customers to defer or tighten discretionary MRO spending, which may in turn weigh on segment volumes.
Energy Services. Steady waste collection volumes and continued optimisation of waste-to-by-product recovery remain the core drivers. Revenue may, however, fluctuate between quarters depending on the timing of orders fulfilled. Management will keep prioritising plant efficiency, by-product yields and capacity enhancement initiatives.
Group priorities. We remain focused on cost discipline, cash generation and working-capital management. The Group continues to maintain active engagement with customers and partners to pursue commercial opportunities. Overall business conditions over the next 12 months are expected to remain challenging, with performance vulnerable to market demand patterns and input-cost movements.