This printed article is located at https://investor.mencast.com.sg/financials.html
Financials
Financial Statements For The Second Half Year And Full Year Ended 31 December 2024
Financials Archive![]() Note: Files are in Adobe (PDF) format.
Note: Files are in Adobe (PDF) format.
Please download the free Adobe Acrobat Reader to view these documents.
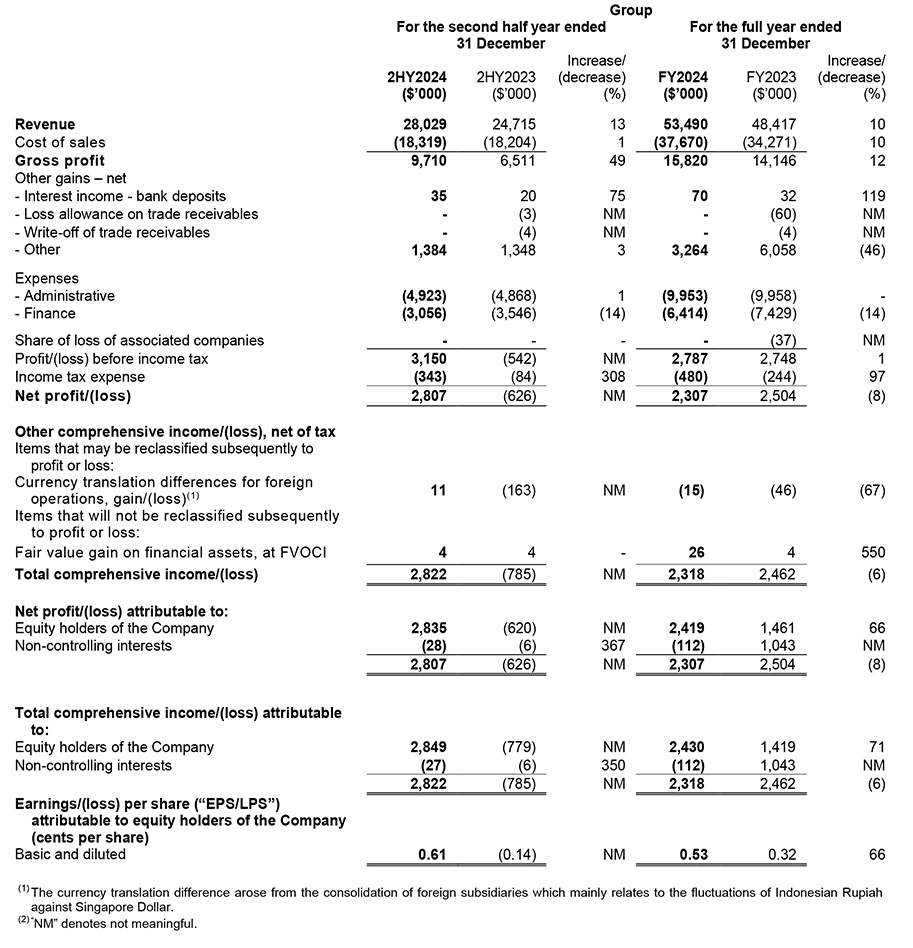
CONSOLIDATED STATEMENT OF COMPREHENSIVE INCOME
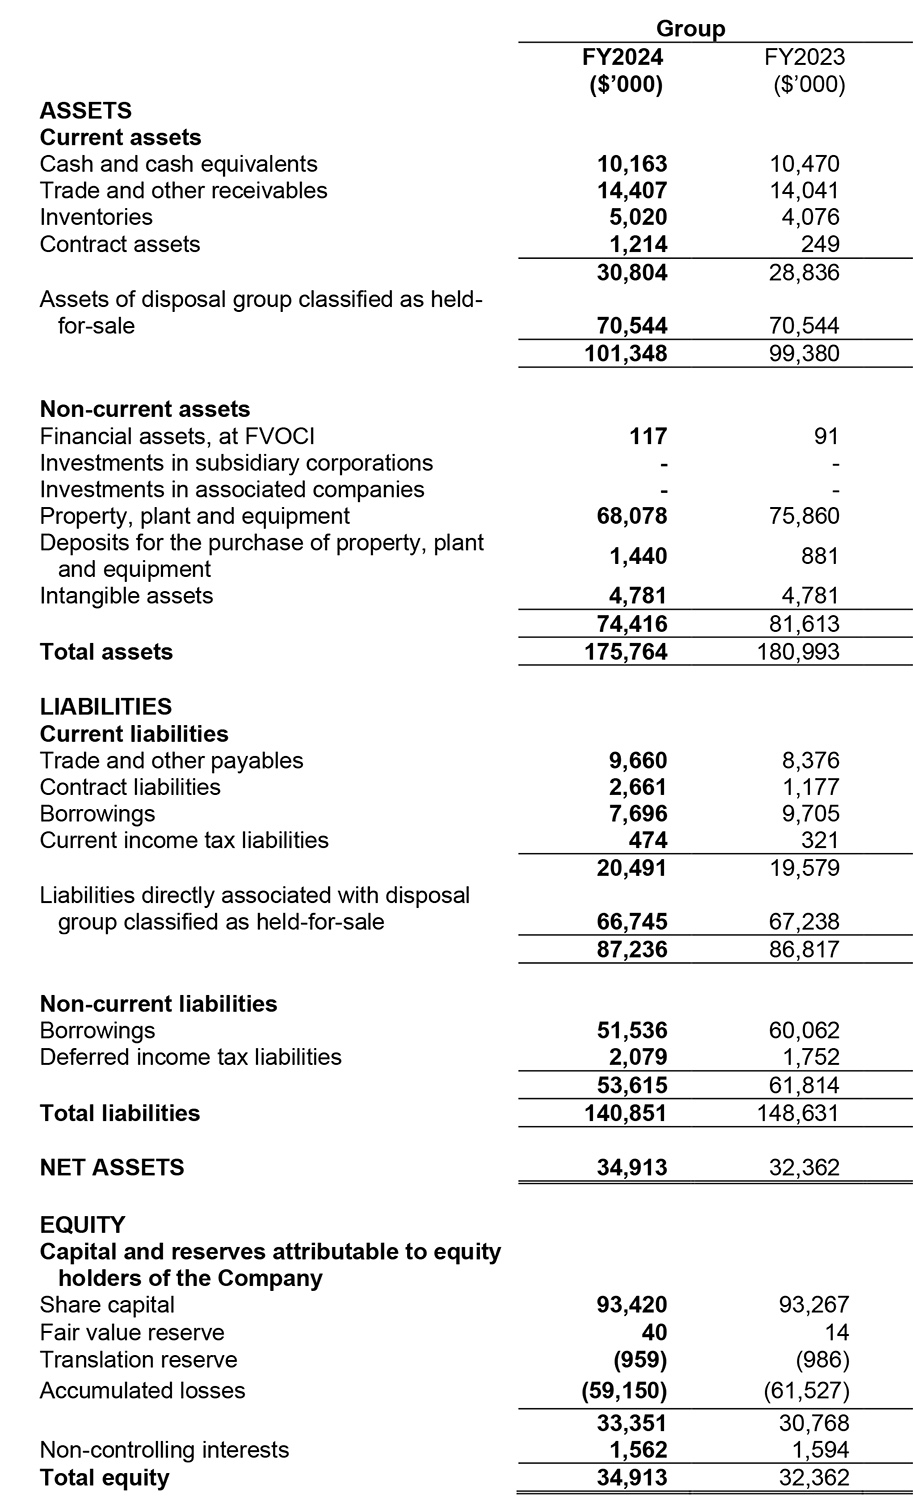
BALANCE SHEETS
Review of Performance
Review of Statement of Comprehensive Income
Revenue
The Group's total revenue increased by $5.1 million or 10% in FY2024 compared to FY2023, with the increases coming from 2HY2024, where there was a 13% increase compared to 2HY2023. The increase in revenue is largely contributed by the Marine and Energy Services segments as indicated below:
- The Energy Services segment contributed an increase of $2.41 million in FY2024;
- The Marine segment increased by $2.31 million.
- The Offshore & Engineering ("O&E") segment is up by $350,000.
Offshore & Engineering segment
Revenue from the O&E segment represents 10% of total revenue for FY2024. The O&E segment's revenue reported an increase of 7% and 4% in FY2024 and 2HY2024, respectively, in comparison to the same periods in FY2023/2HY2023. This was mainly due to:
- Revenue of $0.98 million was recognised in FY2024 from a China subsidiary as a result of the internal restructuring (FY2023/2HY2023: $Nil).
- The precision engineering business showed a decline of 21% year-on-year, from $2.32 million in FY2023 to $1.83 million in FY2024, due to weaker customer demands.
- The offshore structure and steel fabrication business in FY2024 of $2.35 million, showed an 8% decrease in revenue from $2.54 million in FY2023, mainly due to reduced activities.
This also explains the variation in Offshore & Engineering segment revenue in 2HY2024 compared to 2HY2023.
Marine segment
Revenue from the Marine segment represents 50% of total revenue for FY2024. The Marine segment's revenue in FY2024 increased by 9%, up from $24.37 million in FY2023 to $26.69 million in FY2024. This increase was attributable to:
-
An increase in the segment's MRO (maintenance, repairs and overhaul) services, which grew from $11.05 million in FY2023 to $12.17 million in FY2024.
- Revenue from propulsion system MRO services increased by $1.53 million, or 19%, reaching $9.69 million in FY2024.
- Ship repair works showed reduced activity in FY2024, declining by $0.41 million, or 14%, from $2.89 million in FY2023.
- Revenue from new build propellers in FY2024 totalling $14.52 million was up by 9%, from $13.32 million in FY2023.
Energy Services segment
Revenue from the Energy Services segment represents 40% of total revenue for FY2024. Overall, the Energy Services Segment increased by 13%, from $19.18 million in FY2023 to $21.59 million in FY2024. The increase was mainly due to a fast-track trading contract of $4.46 million and new revenue streams generated through the conversion of waste to the by-product for sale, totalling $2.95 million. This was however offset by a weaker revenue from the collection of toxic waste of $5.00 million due to lower work orders during FY2024.
This also explains the variation in Energy Services segment revenue in 2HY2024 compared to 2HY2023.
Cost of sales, gross profit ("GP") and gross profit margin
The Group's cost of sales increased by $3.40 million, or 10%, from $34.27 million in FY2023 to $37.67 million in FY2024, in line with the increase in the Group's revenue.
The Group's gross profit increased by $1.67 million, from $14.15 million in FY2023 to $15.82 million in FY2024. As a result, the Group's gross profit margin, as a percentage of revenue, improved from 29% in FY2023 to 30% in FY2024.
The following factors contributed to the increase in gross profit:
Marine segment: An increase of approximately $2.90 million, or 31%, in gross profit from MRO services and new-build propellers. This also explains the variation in the Marine segment's gross profit between 2HY2024 and 2HY2023.
Offshore & Engineering segment: A reduction in gross losses of approximately $2.49 million from the offshore structure & steel fabrication and precision engineering businesses which was mainly due to cost savings arising from asset divestments in the prior year. This also accounts for the variation in the O&E segment's gross loss between 2HY2024 and 2HY2023. Additionally, Menji Shanghai contributed a positive gross profit of $0.30 million.
The above increases in gross profit were offset by:
Energy Services segment: Despite an overall increase in revenue, gross profit decreased by $3.7 million primarily due to a reduction in the volume of work orders for toxic waste collections which command a higher margin. This decline was, however, partially offset by low gross profit contribution from a fast-track oil trading contract and by-products sale.
Gross profit from the Energy Services segment increased by $0.89 million, from $1.95 million in 2HY2023 to $2.84 million in 2HY2024. This increase was in line with the higher revenue contribution from by-product sales in 2HY2024.
Administrative expenses
Administrative expenses remained relatively the same for the reporting periods FY2024/FY2023 at $9.9 million and the reporting periods 2HY2024/2HY2023 at $4.9 million.
Finance expenses
The Group's finance expenses for FY2024 amounted to $6.41 million, showing a 14% decrease, or approximately $1.02 million, from $7.43 million in FY2023. This reduction was primarily due to a decline in the Group's borrowings through monthly principal repayments as well as the early settlement of borrowings from the proceeds of asset divestment in prior years.
This also explains the fluctuation in finance expenses in 2HY2024 compared to 2HY2023.
Share of loss of associated companies
In FY2023, the Group recorded a share of loss of $37,000 from its remaining associated company, compared to $Nil in FY2024. As of FY2023, the Group and the Company's share of losses in its associated company had already exceeded their interest, therefore, no further losses were recognised in FY2024.
Profit before income tax
The Group's profit before tax (PBT) remained relatively the same for both reporting periods FY2024/FY2023, at approximately $2.8 million.
FY2024 PBT is primarily due to:
- increased in gross profit contributions of $1.67 million as explained above; and
- reduction in finance expenses of $1.02 million; whereas
In FY2023, the PBT of the Group was mainly related to an exceptional gain of $3.79 million from the disposal of an associated company.
Review of Balance Sheet
Current assets
The Group's current assets remained stable at $101.35 million and $99.38 million for FY2024 and FY2023 respectively. The details are explained below:
- Trade and other receivables and contract assets increased by $0.37 million and $0.97 million respectively, primarily due to the following:
- the net increase in trade receivables of $1.91 million, mainly from December 2024 deliveries of new build propellers to customers. This was offset by a decrease in other receivables, primarily due to a reduction of $0.57 million in advances to suppliers from the Marine segment for securing its raw material, and the receipt of the third and final payment tranche of $1.03 million in relation to the disposal of Vac-Tech. A shortfall of $0.06 million was accounted for from the $1.09 million receivables recognised in FY2023 after adjusting the net cash and net working capital changes pursuant to the SPA.
- the increase in contract assets was mainly due to work completion before the year closes but was billed and collected in January 2025 amounting to approximately $0.78 million.
- Inventories increased by $0.94 million from $4.08 million in FY2023, mainly due to increases in the usage of raw materials and ongoing orders for new build propellers in the Marine segment. Offset by
- a net decrease in cash and cash equivalents of $0.32 million, as explained in the Review of Condensed Interim Consolidated Statement of Cash Flows section below.
Non-current assets
The Group's non-current assets as at 31 December 2024 amounted to $74.42 million, a decrease of $7.19 million from $81.61 million in FY2023. The decline was attributable to:
- a $7.78 million decrease in property, plant and equipment, as explained in Part E, Note 12; partially offset with
- an increase in deposits for capital expenditures of $0.56 million, predominantly for the Marine segment; and
- a fair value gain of $0.03 million from financial assets, at FVOCI.
Current liabilities
The Group's current liabilities decreased by $0.42 million, from $86.82 million as at 31 December 2023 to $87.24 million as at 31 December 2024. The decrease resulted from the following:
- Decrease in current borrowings by $2.01 million, mainly attributed to:
- repayment of term loans of $2.36 million, partially offset by:
- an increase in lease liabilities for the hire purchase of motor vehicles of $0.04 million, mainly for the Energy segment; and
- an increase of $0.13 million in lease liability under leasehold land following the reorganisation of Menji Shanghai.
- Decrease in liabilities directly associated with disposal group classified as held-for-sale by $0.49 million, primarily due to the payment of leasehold rental.
- Net increase in trade and other payables and contract liabilities of $2.77 million, mainly due to the following:
- an increase in contract liabilities of $1.48 million, primarily due to an increase in advances from customers for ongoing new build projects in FY2024 compared to FY2023.
- a net increase in trade and other payables of $1.28 million, mainly due to:
- accrual of costs amounting to $0.58 million in relation to a completed project,
- GST payables increased by $0.24 million as a result of higher revenue in 4Q2024 compared to 4Q2023, and
- deposit of $0.20 million for the sale of a certain vessel.
- An increase in current income tax liabilities of $0.15 million, mainly due to under-provision of current income tax in prior years from the Marine segment.
Offset by
Non-current liabilities
As at 31 December 2024, the Group's non-current liabilities stood at $53.61 million, representing a decrease of $8.20 million, or 13%, compared to $61.81 million as at 31 December 2023. This reduction is primarily due to:
- repayment of bank loans and lease liabilities, reflecting the Group's continued efforts to manage and reduce its long-term obligations; offset by
- The under-provision of deferred income tax liabilities in prior years.
Review of Full Year Consolidated Statement of Cash Flows
The Group recorded a net cash inflow from operating activities of $17.78 million primarily due to:
- Higher operating income before changes in working capital amounted to $18.12 million.
- A net decrease in working capital of $0.34 million.
The Group also generated a net cash inflow from investing activities of $0.17 million, mainly due to:
- A cash receipt of $1.05 million from an asset-related government grant.
- Proceeds of $1.03 million from the third and final tranche payment related to the disposal of Vac-Tech.
- Additional cash inflow of $0.19 million resulting from the business combination of Menji Shanghai;
- Proceeds of $0.15 million from the disposal of PPE.
These inflows were partially offset by:
- A cash outlay of $2.24 million for the purchase of PPE, mainly for the operational needs in the Energy Services and Marine segments.
The net cash used in financing activities amounted to $18.27 million, mainly due to the following:
- Repayment of bank borrowings totalling $10.90 million.
- Interest payments of $6.47 million.
- Repayment of lease liabilities of $1.40 million.
- A partial dividend payment of $0.30 million to minority interest.
This outflow was partially offset by:
- Net usage of trade financing amounting to $0.80 million.
Commentary
The Group is navigating through a challenging landscape marked by high-interest costs and inflationary pressures. As we forge ahead, we remain vigilant against possible obstacles, including sustained elevated interest rates and rising operating costs exacerbated by a tight labour market. Additionally, we closely monitor geopolitical tensions and supply chain disruptions that could impact material costs and potentially squeeze our margins.
Despite these challenges, our outlook on market demand for our core businesses is cautiously optimistic. We make concerted efforts towards effective execution of our projects and continue to focus on improving our processes and strengthening our support to our customers across various sectors—including marine, offshore, oil and gas, petrochemical, infrastructure, chemical and manufacturing.
We are actively seeking new business opportunities and innovations while maintaining a prudent focus on operational cost management. We believe this strategy to be essential for building resilience in our operations and pivotal to securing sustained demand for our offerings in the foreseeable future.